
Key takeaways
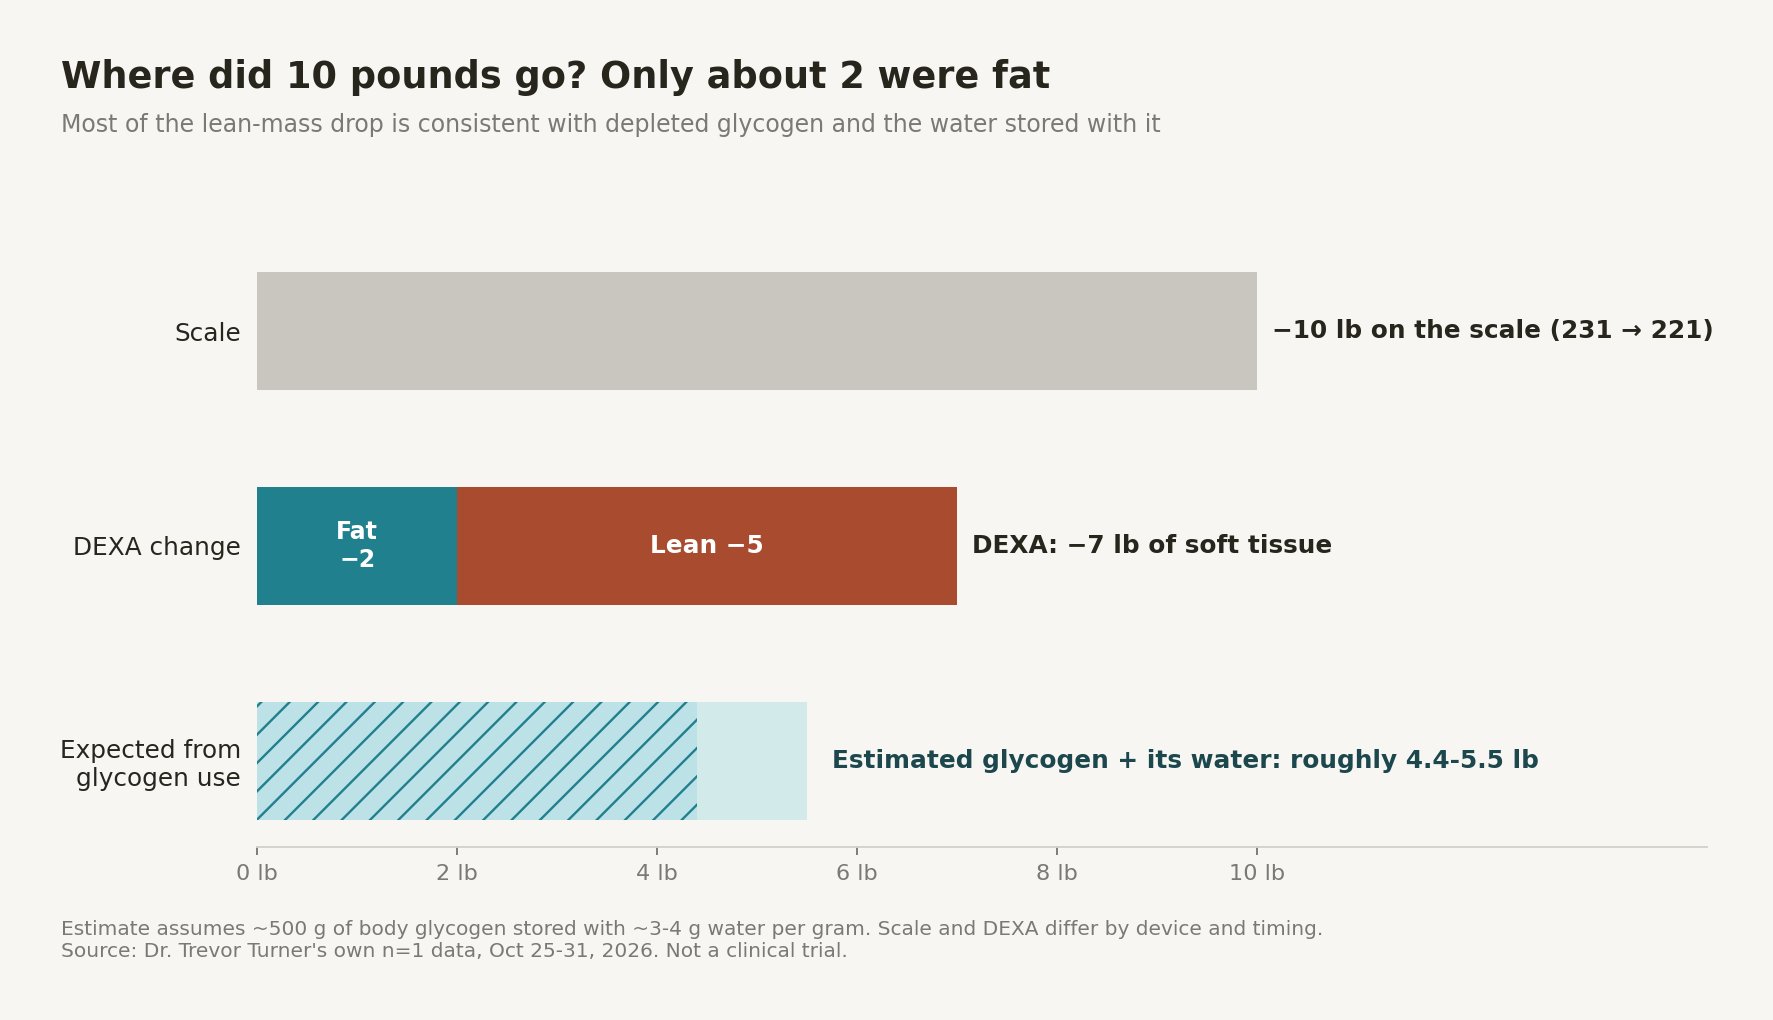
- I did one 5-day ProLon fasting-mimicking cycle and measured everything: daily weight, HRV, sleep, finger-stick glucose and blood ketones, plus a DEXA scan before (October 25) and after (October 31).
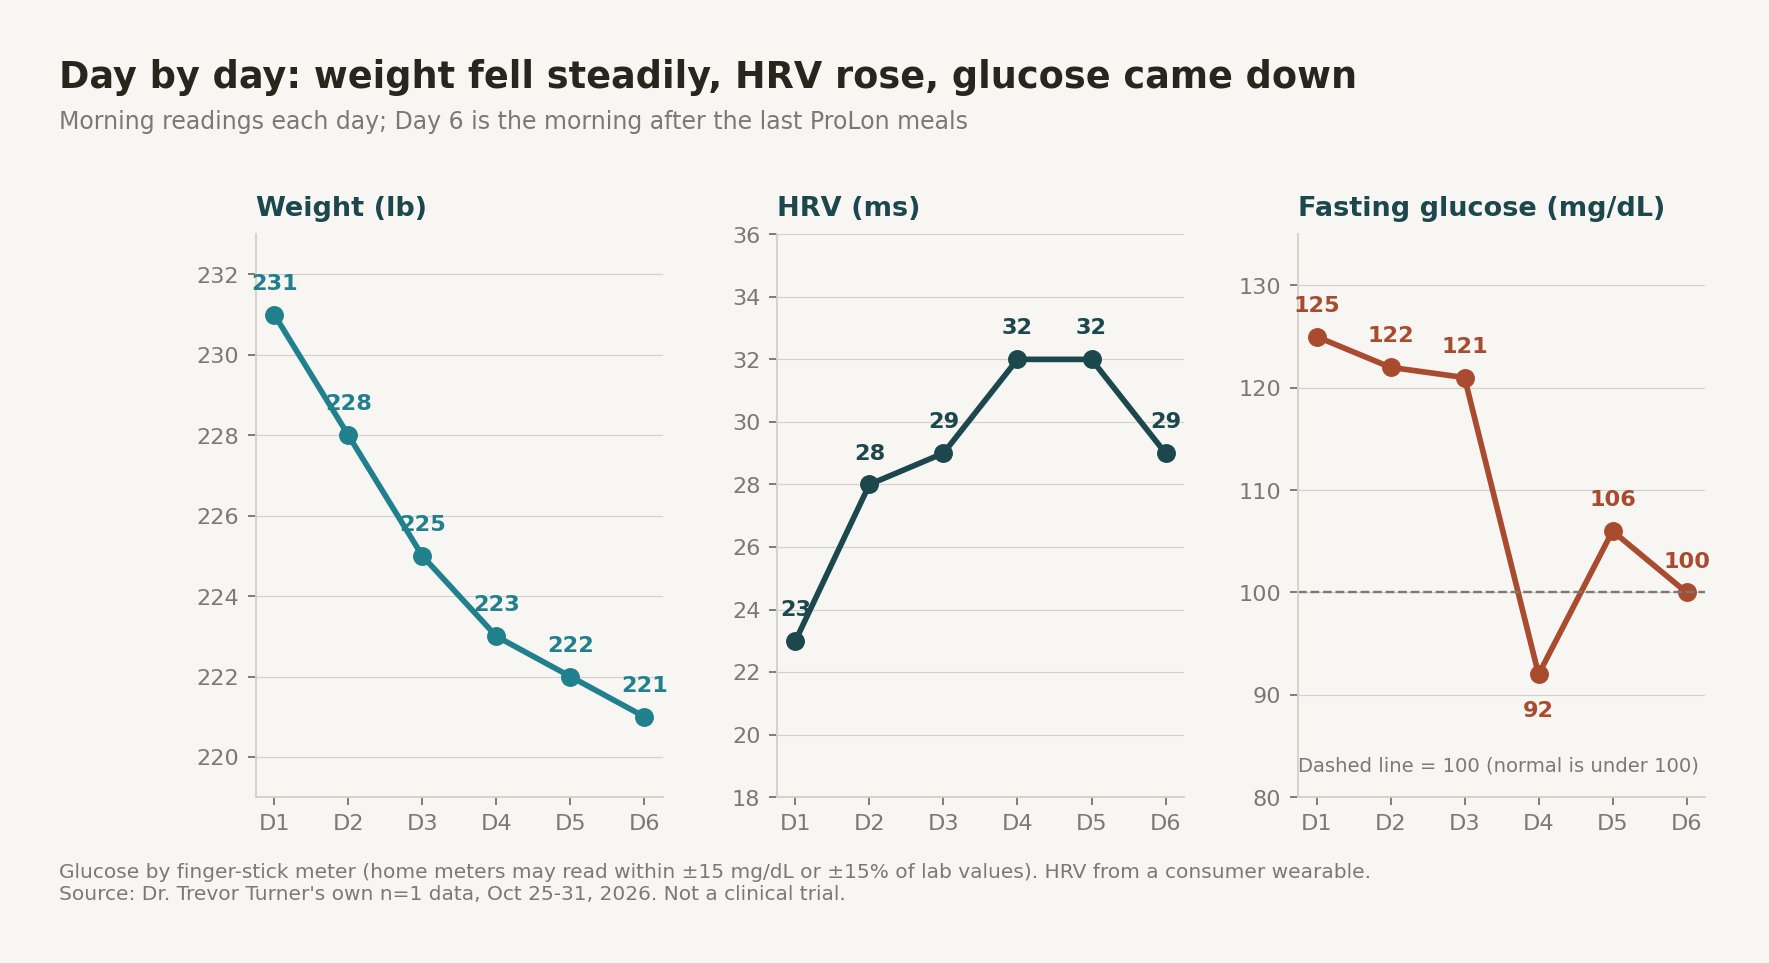
- The scale dropped 10 lb, but DEXA showed only about 2 lb of fat loss. Most of the rest was lean mass, which DEXA counts together with stored glycogen and water. Much of that is expected to come back when normal eating resumes.
- Ketones rose later than the box suggests. The packaging says ketogenesis begins on Day 2; my meter did not cross 0.5 mmol/L until Day 5.
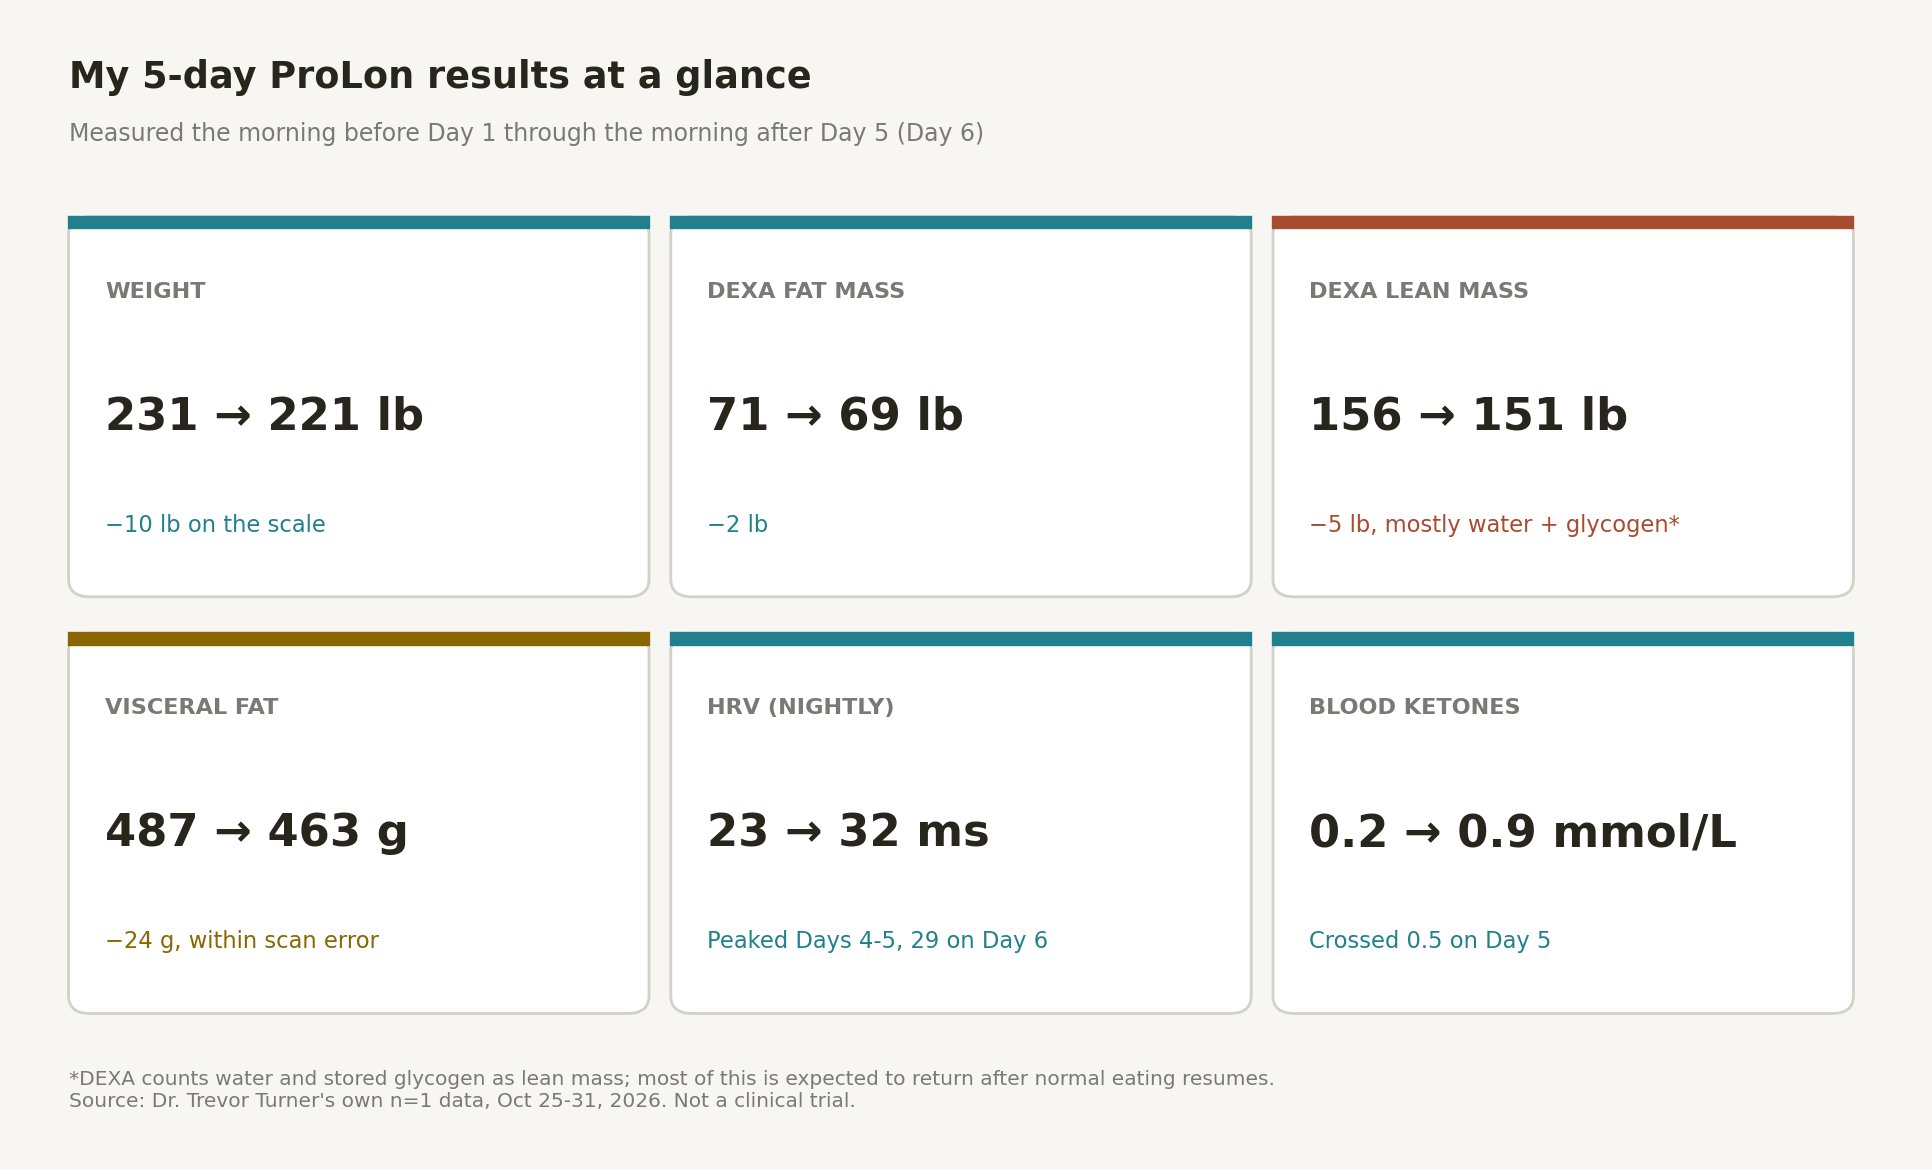
- HRV rose from 23 to 32 ms and fasting glucose fell from 125 to the 90s–100s. These are encouraging single-person numbers, not proof of a lasting effect.
- The visceral fat change (−24 g) was smaller than the scanner’s error margin. I can’t call it real yet. The honest test is a repeat scan after refeeding and after more cycles.
Why I tracked my own ProLon cycle
I have written about the science behind the fasting-mimicking diet and recorded a short video series about each day of the box. Patients keep asking a practical question: “What actually happens to your body during those five days?” Published trials report group averages. I wanted to see what one real person’s numbers look like, measured with the same consumer tools many of my patients use, and then explain what those numbers can and cannot tell us.
This is an n-of-1 experiment, which means it is one person, one cycle, with no control group. I am a 231-lb man who started with a fasting glucose reading in the prediabetes range, so my results may not look like yours. This post is not sponsored, and Pravida Health has no financial relationship with L-Nutra, the company that makes ProLon.
My data, day by day
I took readings each morning. Day 6 is the morning after the last ProLon meals. Glucose and ketones came from finger-stick meters, and HRV and sleep came from a consumer wearable.
| Day | Weight (lb) | HRV (ms) | Sleep (deep / REM) | Glucose (mg/dL) | Ketones (mmol/L) |
|---|---|---|---|---|---|
| Day 1 | 231 | 23 | 6 h 51 m (1 h / 30 m), score 58 | 125 | 0.2 |
| Day 2 | 228 | 28 | 8+ h (3 h 41 m / 90 m) | 122 | 0.1 |
| Day 3 | 225 | 29 | 8+ h (2 h / 70 m) | 121 | Meter error |
| Day 4 | 223 | 32 | 5.5 h (2 h / 45 m) | 92 | 0.4 |
| Day 5 | 222 | 32 | 8 h (2 h / 2 h) | 106 | 0.7 |
| Day 6 | 221 | 29 | 8 h (80 m / 2 h) | 100 | 0.9 |
Where did 10 pounds go?
A 10-lb drop in five days sounds dramatic, and it is the number most people would post. It is also the most misleading. My DEXA scans showed fat mass fell from 71 to 69 lb (about 0.9 kg) and lean mass fell from 156 to 151 lb (about 2.3 kg). The rest of the gap between the scale and the scan is consistent with ordinary differences in timing, hydration and gut contents.
The lean-mass drop needs context. DEXA “lean mass” is not the same as muscle. It includes water, organs and stored carbohydrate (glycogen), and a 2026 review notes that DXA lean mass can miss true changes in muscle over time (Communications Medicine). The body stores roughly 500 g of glycogen, and each gram is stored with at least 3 g of water (Nutrients review). Using up most of that store can account for roughly 4 to 5.5 lb, which is why the early weight loss on very-low-calorie diets is mostly water and glycogen (Cal State nutrition text).
This matches the published research. In the main randomized trial of the fasting-mimicking diet, 100 adults did three monthly cycles. Measured 5 to 7 days after returning to normal eating, the diet group lost an average of 2.6 kg (about 5.7 lb), with reductions in total and trunk fat. Absolute lean mass also fell slightly, while lean mass as a share of body weight rose (Wei et al., Science Translational Medicine 2017). Three cycles and a refeeding period produced about half of what my scale showed after one cycle. That’s the realistic expectation.
My rough body-fat percentage (fat divided by fat plus lean) went from 31.3% to 31.4%, essentially unchanged. ALMI, a measure of limb muscle adjusted for height, went from 10.8 to 10.1 kg/m². That is still well above the European sarcopenia cutoff of 7.0 for men (EWGSOP2, Age and Ageing 2019), and limb lean mass is also affected by glycogen and water. I expect most of it to recover. The follow-up scan will tell me.
Signal vs. noise on the DEXA scan
Every scanner has a measurement error. The “least significant change” is the smallest change you can trust with 95% confidence, calculated as 2.77 times the scanner’s precision error (Hind et al.). In a GE Lunar iDXA precision study, that threshold was about 0.48 kg for fat mass, 0.62 kg for lean mass and 81 g for visceral fat in healthy adults, and higher in patients (PubMed). A separate study of visceral fat measurement found a threshold of about 131 g, with larger errors in people with obesity (Obesity).
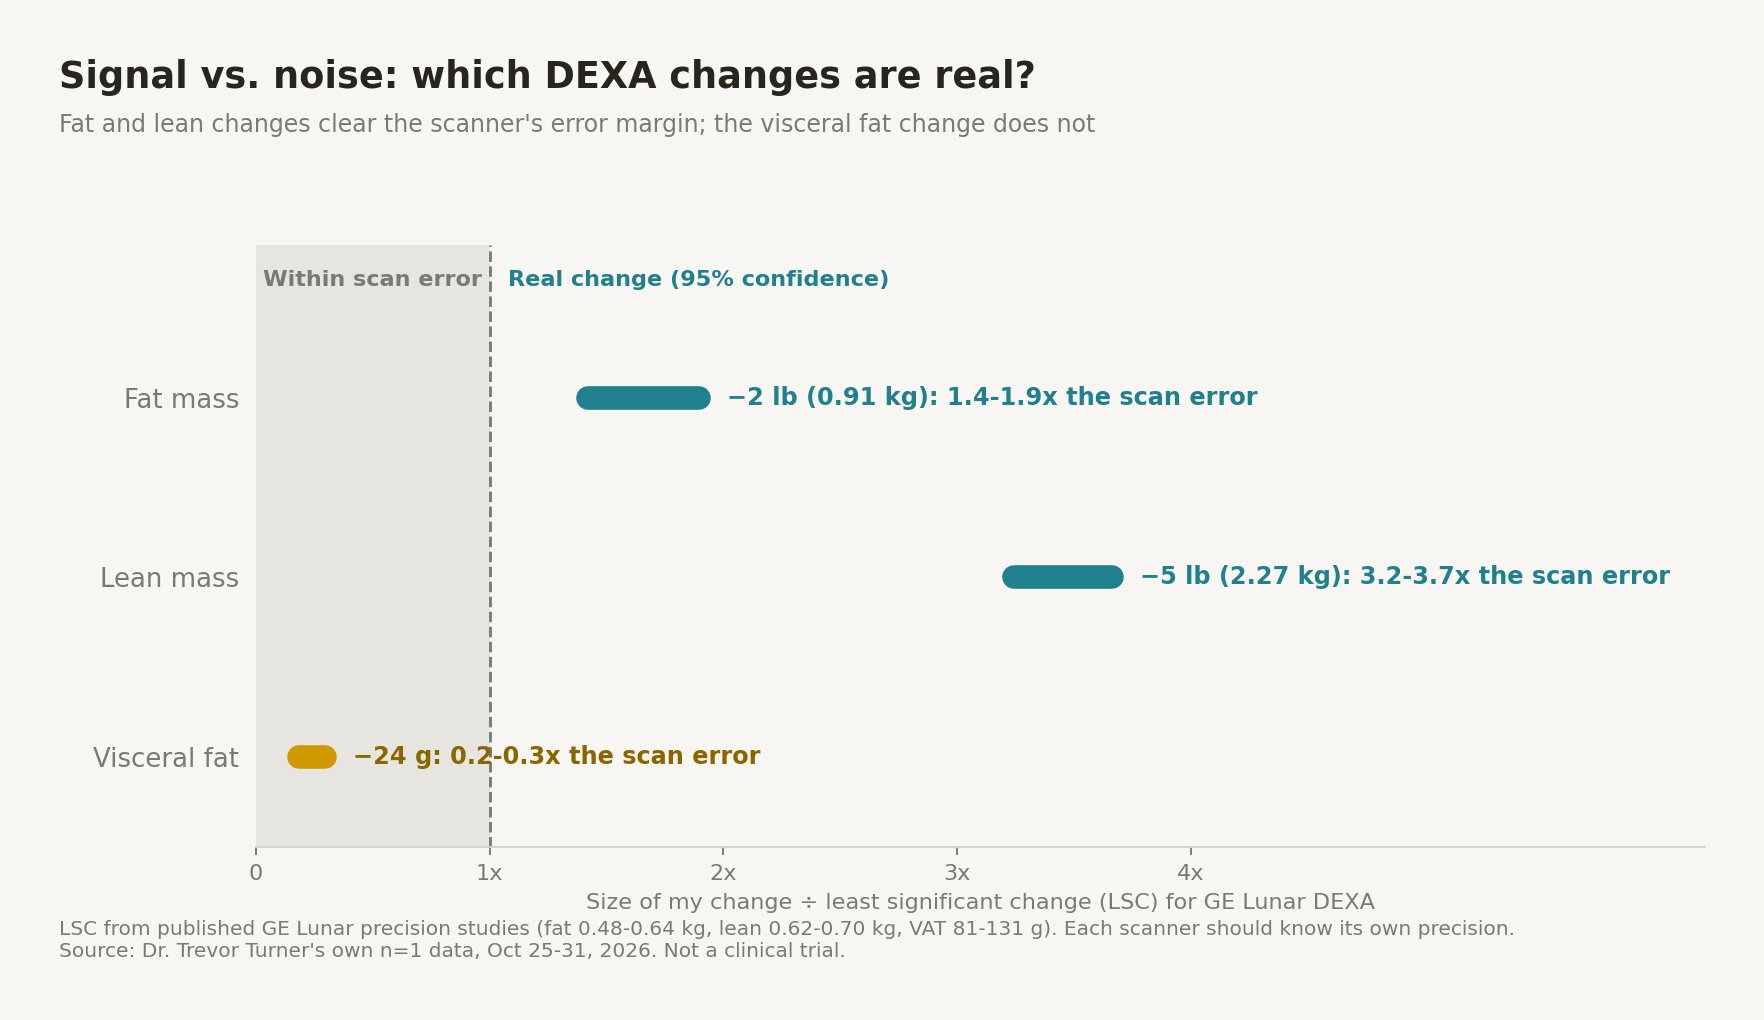
By those numbers, my 2-lb fat loss and 5-lb lean loss are real measured changes. My 24-g visceral fat drop is well inside the noise, so I can’t claim it, even though it is tempting. If you track your own body composition, ask your DEXA provider for their scanner’s precision values and use the same machine, time of day and hydration routine each time.
Ketones: the box vs. my body
Each ProLon box has a theme. Day 2 is labeled for fat burning and ketogenesis. My blood beta-hydroxybutyrate read 0.1 on Day 2, 0.4 on Day 4 and did not cross the common 0.5 mmol/L threshold for nutritional ketosis (review on ketone thresholds) until Day 5. The Day 3 strip returned an error.
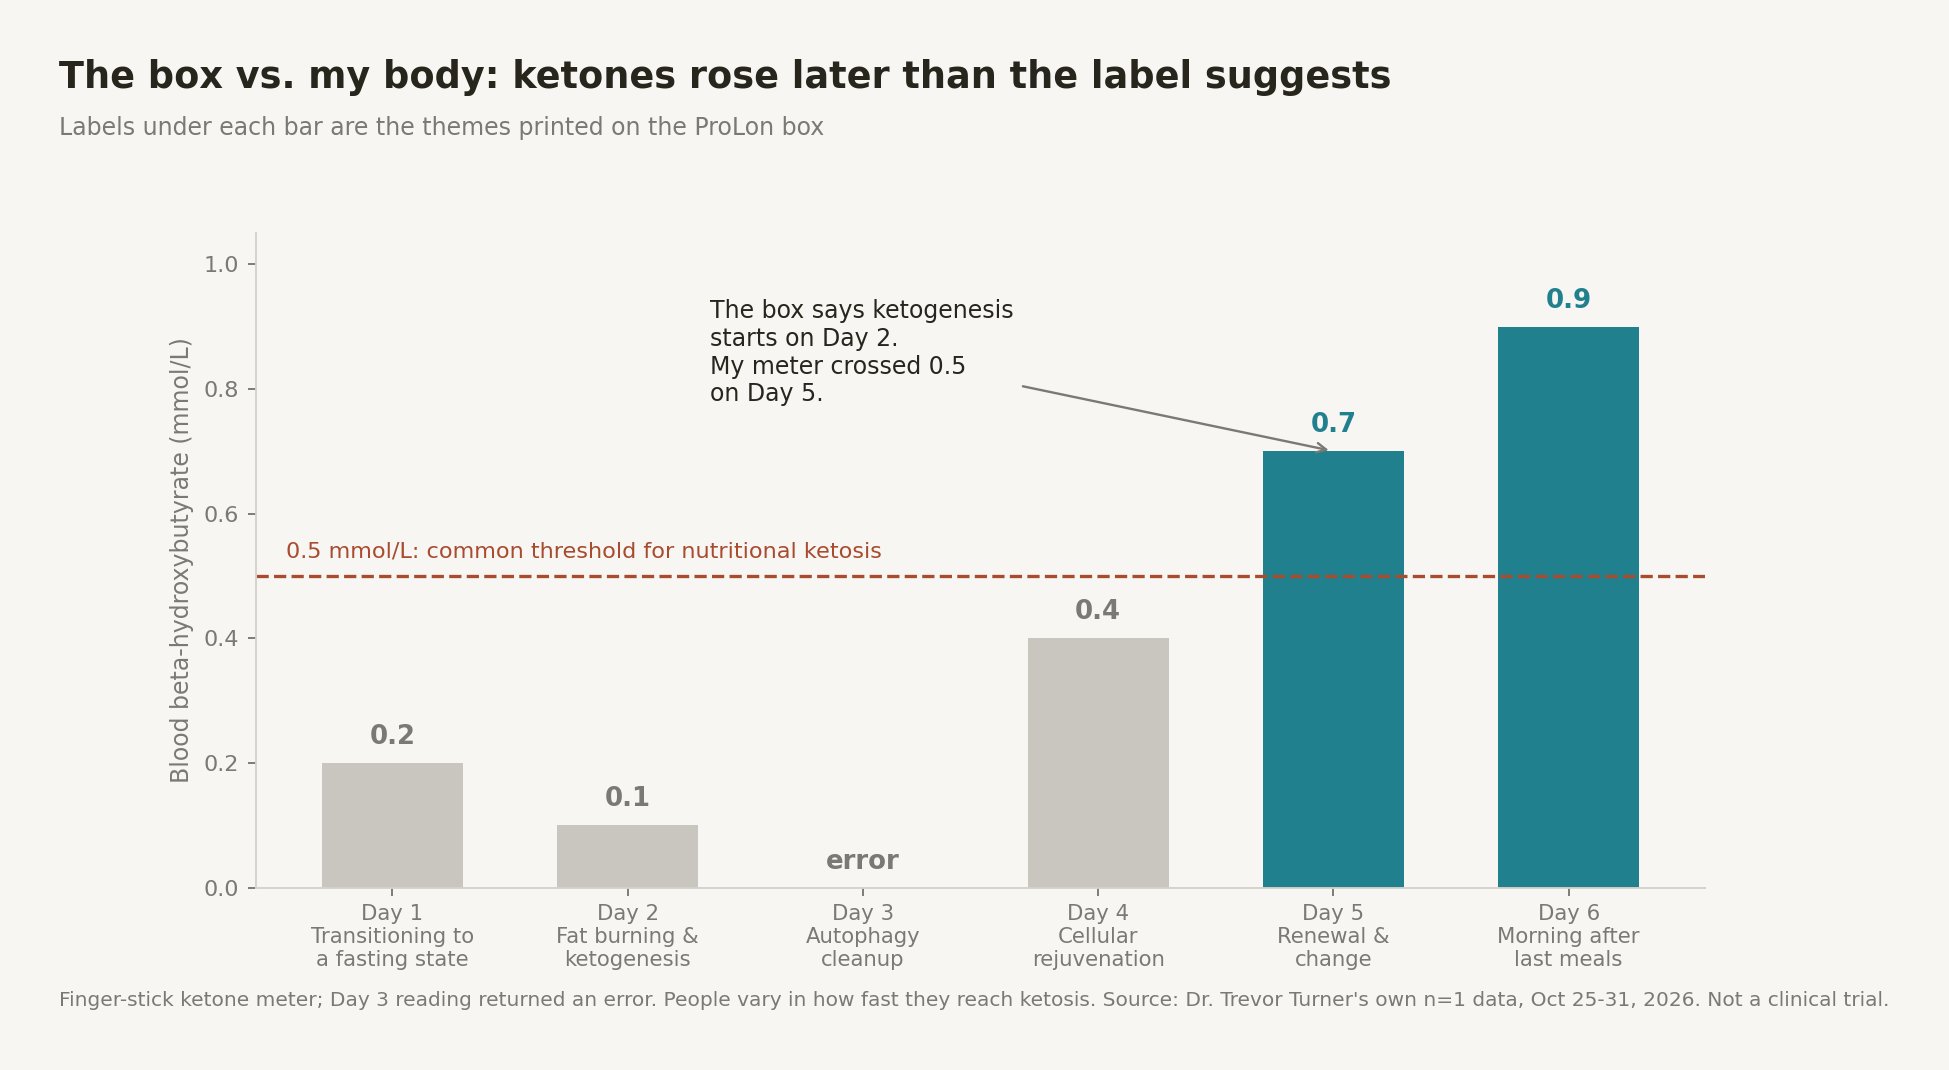
That is not unusual. In a 2026 study of people starting a ketogenic diet, about 60% took 5 to 8 days to reach 0.5 mmol/L (Nutrition & Diabetes). Starting with higher body weight and higher fasting glucose, as I did, may slow the switch. In the original FMD trial, ketones rose by Day 5 and returned to baseline after refeeding (Wei et al.). Finger-stick ketone meters can also read higher than lab tests (American Journal of Physiology), so I treat the exact numbers as approximate and the trend as the useful part.
Glucose: one reading is not a diagnosis
My Day 1 fasting glucose was 125 mg/dL. The American Diabetes Association defines prediabetes as a fasting glucose of 100 to 125 mg/dL, and diabetes as 126 or higher confirmed on repeat testing, using laboratory tests rather than home meters (ADA Standards of Care 2026; American Diabetes Association). Home meters only need 95% of results to fall within ±15 mg/dL below 100, or ±15% at 100 and above (ISO 15197:2013 review). So a single 125 could be a true 106 or a true 144.
What I take from it is that I need lab confirmation, and that is on my list: a lab fasting glucose, A1c and fasting insulin. During the cycle, glucose fell to 92 on Day 4, even after only 5.5 hours of sleep, and was 100 on Day 6. The original trial found no significant change in fasting glucose for the whole group, with larger benefits in people who started with higher risk markers (Wei et al.). A five-day drop during calorie restriction is expected. The real question is where my numbers settle weeks later. A continuous glucose monitor would give a fuller picture than one morning finger-stick.
Sleep and HRV
Night 1 was my worst: 6 h 51 m, 1 h of deep sleep and a sleep score of 58. From Day 2 on, sleep was mostly 8 hours or more, except a 5.5-hour night before Day 4. HRV rose from 23 ms to 32 ms on Days 4 and 5, then eased to 29 on Day 6.
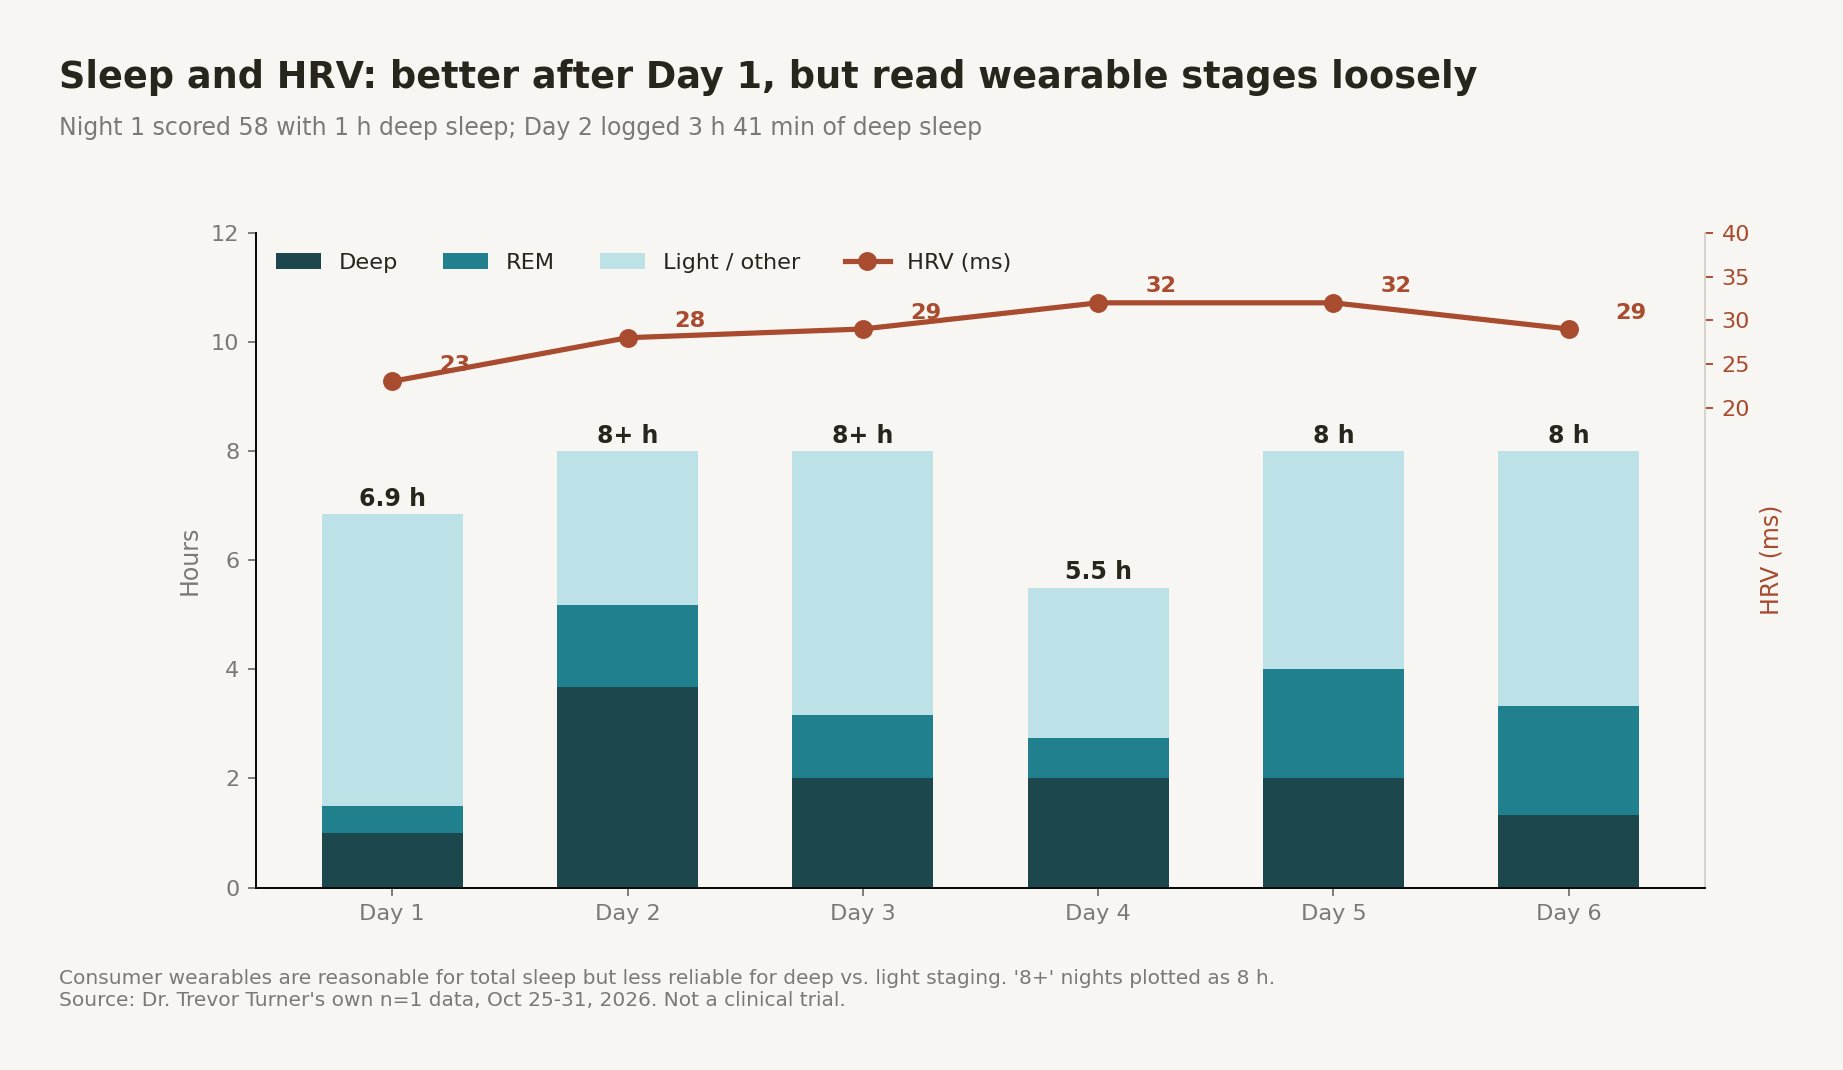
Consumer wearables are reasonable for total sleep time but less reliable for sleep stages. In a 2024 comparison against lab sleep studies, the size of the deep-sleep error varied by device (Sensors 2024). A 3 h 41 m deep-sleep night is unusual and may partly reflect how the device classifies sleep. HRV is also personal and noisy from night to night, so I compare it only with my own baseline. A higher HRV during the cycle is interesting, but I would need repeat cycles to know whether it reflects the fast, the lighter digestive load, extra rest or chance. For the habits that matter most, see my evidence guide to sleep hygiene, and for how AI tools interpret this kind of data, see my review of the AI personal health agent study.
What I would tell a patient
- Judge the cycle by your post-refeeding scan, not the Day 6 scale. Rescan 1 to 2 weeks after normal eating resumes, under the same conditions.
- Expect most of the early weight loss to be water and glycogen. Fat loss per cycle is modest; the trial benefits came from repeated cycles.
- Don’t chase the box’s timeline. Many people reach ketosis later than Day 2.
- Confirm abnormal home readings with a lab. A meter is a screening tool, not a diagnosis.
- Protect muscle around the cycle. Resume protein and resistance training after refeeding, and talk with your clinician first if you have diabetes, take glucose-lowering or blood pressure medication, or are pregnant, underweight or have a history of eating disorders.
My next steps are a lab panel for glucose, A1c and insulin, a repeat DEXA scan after refeeding, and a decision on whether to repeat the cycle. If I do, I’ll publish those numbers too, including any that don’t look good. You can read more about the research on advanced biomarkers, and the FMD trials on biological age (Brandhorst et al., Nature Communications 2024) and in animals (Brandhorst et al., Cell Metabolism 2015).
Want to measure what your fast actually does?
A scale can’t tell fat from water. A physician-guided plan can show you what changed and what didn’t.
- DEXA body composition with consistent before-and-after protocols
- Lab fasting glucose, A1c, insulin and advanced biomarkers
- Review of your wearable, glucose and ketone data with a clear plan
Pravida Health, 1801 Peachtree St NE, Suite 150, Atlanta, GA 30309. Call 404-900-7371, email info@pravida.com or request an appointment.
Frequently asked questions
How much weight do you lose on ProLon?
I lost 10 lb on the scale over one 5-day cycle, but DEXA showed only about 2 lb of fat loss. Most early weight loss is glycogen and water, which returns with normal eating. In the main clinical trial, people lost an average of 2.6 kg (about 5.7 lb) after three monthly cycles, measured about a week after refeeding.
Does ProLon cause muscle loss?
My DEXA lean mass fell 5 lb, but DEXA lean mass includes water and glycogen, and the size of the drop matches what glycogen depletion would predict. In the clinical trial, absolute lean mass fell slightly while lean mass as a share of body weight rose. A repeat scan after refeeding is the best way to check.
When do you get into ketosis on ProLon?
It varies. The box says ketogenesis begins on Day 2, but my blood ketones did not cross 0.5 mmol/L until Day 5. In a 2026 study, about 60% of people starting a ketogenic diet took 5 to 8 days to reach that level.
Does ProLon lower blood sugar?
My finger-stick fasting glucose dropped from 125 to 92 by Day 4 and was 100 on Day 6. Short-term drops are expected during calorie restriction. The clinical trial found no significant change in fasting glucose overall, with larger improvements in people who started with higher risk markers. Confirm any abnormal readings with lab tests.
Can a DEXA scan detect changes after one fasting cycle?
Yes, for fat and lean mass if the change is larger than the scanner’s least significant change, often around 0.5 kg for fat and 0.6 kg for lean on GE Lunar systems. Visceral fat changes need to be larger, roughly 80 to 130 g, so my 24-g change was within measurement error.
Sources
- Wei M, Brandhorst S, Shelehchi M, et al. Fasting-mimicking diet and markers/risk factors for aging, diabetes, cancer, and cardiovascular disease. Science Translational Medicine, 2017. PMC.
- Brandhorst S, et al. Fasting-mimicking diet causes hepatic and blood markers changes indicating reduced biological age and disease risk. Nature Communications, 2024. Nature Communications.
- Brandhorst S, et al. A periodic diet that mimics fasting promotes multi-system regeneration, enhanced cognitive performance, and healthspan. Cell Metabolism, 2015. PMC.
- GE Lunar iDXA precision and least significant change for body composition and visceral fat. PubMed.
- Precision of DXA visceral adipose tissue measurement. Obesity, 2018. Wiley.
- Hind K, et al. Interpretation of dual-energy X-ray absorptiometry-derived body composition change. Leeds Beckett University.
- DXA lean mass and longitudinal muscle change. Communications Medicine, 2026. Nature.
- Cruz-Jentoft AJ, et al. Sarcopenia: revised European consensus on definition and diagnosis (EWGSOP2). Age and Ageing, 2019. ESCEO.
- Glycogen storage and water binding. Nutrients review. PMC.
- Healthy long-term weight management. Nutrition and Fitness, California State University. Cal State Pressbooks.
- Nutritional ketosis thresholds review. PMC.
- Time to reach nutritional ketosis. Nutrition & Diabetes, 2026. Nature.
- Capillary vs. venous ketone measurement. American Journal of Physiology: Endocrinology and Metabolism. APS Journals.
- American Diabetes Association. Standards of Care in Diabetes, 2026: Diagnosis and Classification. PMC; diabetes.org.
- ISO 15197:2013 accuracy requirements for blood glucose meters. PMC.
- Accuracy of Three Commercial Wearable Devices for Sleep Tracking in Healthy Adults. Sensors, 2024. MDPI.