

A better way to answer “Am I at risk for a heart attack?”
Every patient who asks me some version of “am I going to have a heart attack” is really asking two separate questions that traditional tools answer poorly. The first tool most of us learned to reach for — the Framingham score or the ASCVD Pooled Cohort Equations — estimates probability from a demographic profile: age, sex, blood pressure, lipids, smoking status. It never looks inside the artery. A coronary calcium score is a genuine step up because it looks at the actual coronary tree, but it only sees hardened, calcified plaque. It is structurally blind to the soft, low-attenuation plaque that is most likely to rupture and cause the event we are actually trying to prevent.
The physician insight that changed how I think about this workup is simple: a coronary CT angiogram already looks directly at the coronary tree, lumen and vessel wall together, in a way a calcium score cannot. What has been missing is quantification — a reproducible, non-subjective way to measure the plaque that is there, characterize what it is made of, and stage the atherosclerosis across the whole vessel tree rather than eyeballing it. That is what Cleerly adds on top of a standard CCTA scan. What Cleerly is, at its core, is an FDA-cleared AI layer that turns the CCTA’s raw images into a quantified, reproducible plaque report.
Those accuracy numbers come from the CLARIFY-2 substudy by Griffin and colleagues in JACC: Cardiovascular Imaging, and the reduction in overestimated severe stenosis comes from Kim et al., cited in the Palmetto GBA coverage determination for AI-quantitative coronary CT analysis. Both numbers matter for the same reason: human readers, even expert ones, are inconsistent at eyeballing stenosis severity and plaque composition from a CCTA. Quantification is not a luxury feature here — it is the missing piece.
What Cleerly actually does on top of a CCTA
The workflow starts the same way any CCTA does. The patient gets a standard coronary CT angiogram at any qualified imaging center — no special scanner, no special contrast protocol beyond what a good cardiac CT already requires. The DICOM images are then sent to Cleerly Labs, a cloud-based analysis pipeline that is FDA-cleared for this specific purpose. The FDA clearance history under K190868 and K202280 covers the core plaque-quantification and stenosis-characterization software. The AI segments the entire coronary tree, identifies the lumen and vessel wall boundaries at sub-voxel resolution, and then quantifies and characterizes every plaque it finds — not just the ones a reader happens to flag.
The outputs are what make this clinically actionable rather than just a prettier picture:
- Total plaque volume in mm³, with a per-vessel breakdown across the coronary tree
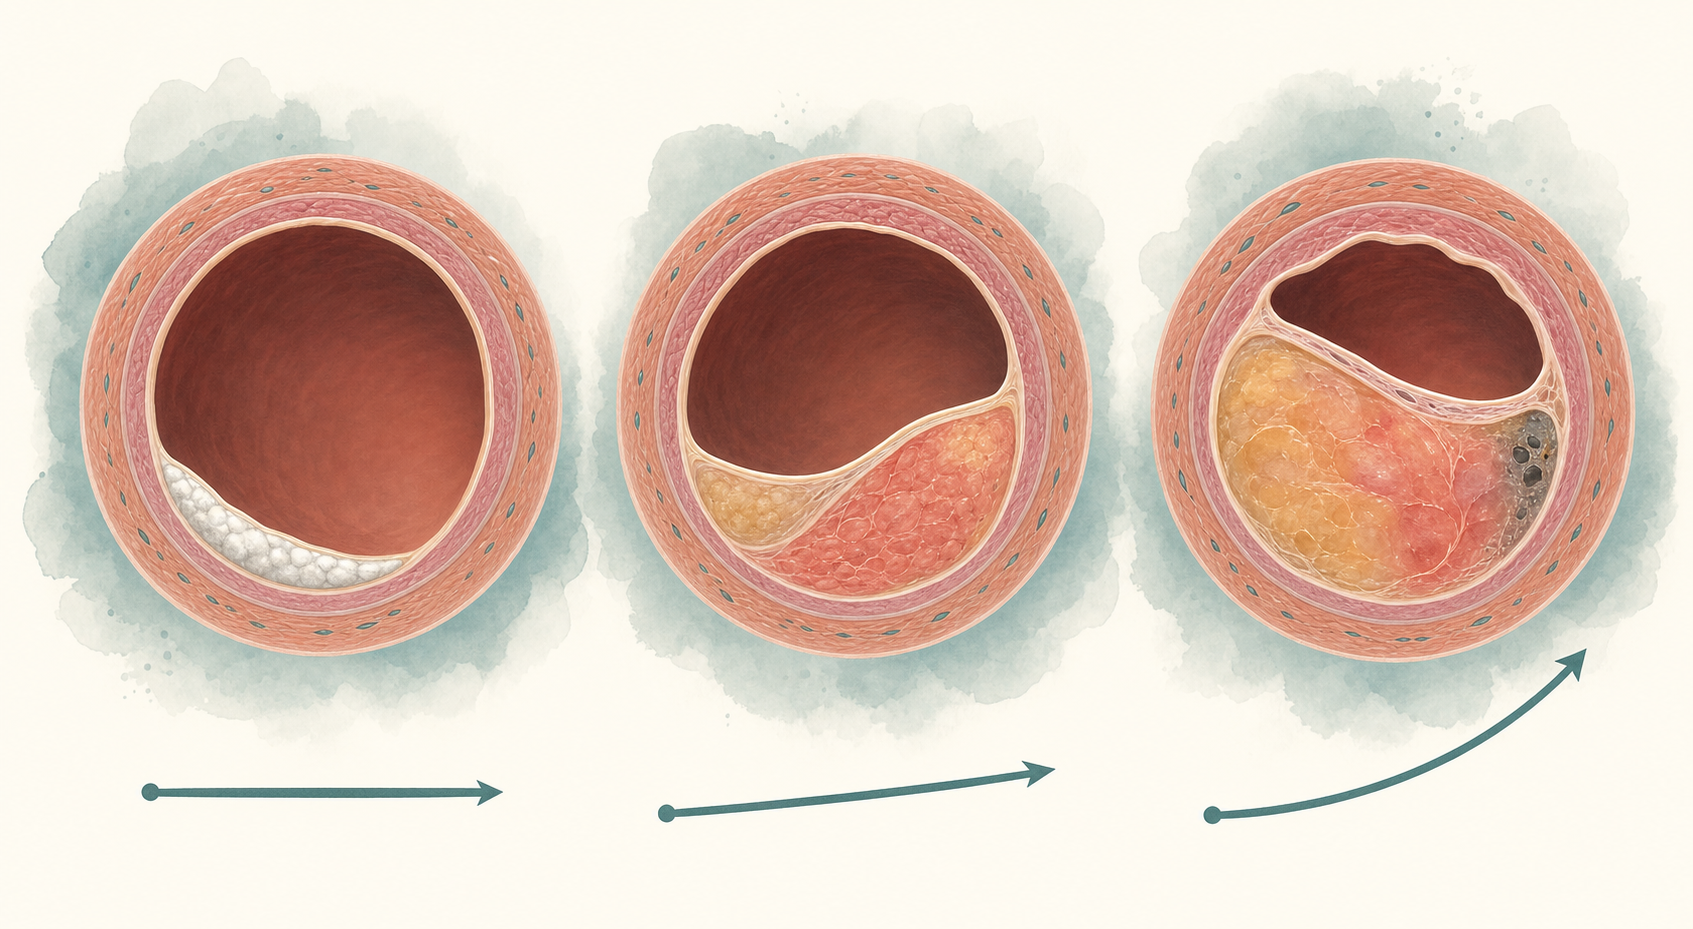
- Plaque composition split into calcified, non-calcified, and low-attenuation-non-calcified categories
- Stenosis severity expressed in both 2D (diameter, area) and 3D (lumen volume vs vessel volume)
- A likelihood-of-ischemia assessment, delivered through the separately cleared Cleerly ISCHEMIA module
- A CAD-RADS 2.0-compatible staging, from P0 (no plaque) → P4 (extensive plaque burden)
Cleerly ISCHEMIA received 510(k) clearance in January 2024, extending the platform from pure anatomic quantification into a functional likelihood-of-ischemia read. But the piece I find most clinically novel is not any single snapshot metric — it is disease *tracking*. The FDA-cleared workflow explicitly recommends a rescan interval, so a physician can see whether a medical therapy regimen is actually stabilizing or reducing plaque volume over time, rather than just confirming that plaque exists on a single scan.
That tracking capability matters more than it sounds, because the alternative — human visual read — has a documented consistency problem. An interobserver-variability substudy found that expert readers achieved only moderate consistency when characterizing high-risk plaque features by eye, with kappa values in the 0.17-0.26 range. That is a genuinely humbling number for a field that has relied on visual read for two decades, and it is exactly the problem a reproducible, quantitative AI layer is built to solve.
What the clinical trials show, and where the evidence gets careful
I want to walk through the four highest-quality trials in the order I’d present them to a skeptical colleague, with the hard numbers attached and the honest caveats included.
The first multicenter validation is CLARIFY multicenter validation (Choi et al., Journal of Cardiovascular Computed Tomography, 2021, N=232) — if that DOI landing does not resolve for you, the same findings are summarized in a PMC review of the AI-QCT validation literature. CLARIFY compared the AI output against L3 expert reader consensus and found the AI matched CAD-RADS category within one tier in 98.3% of patients, with an analysis time of roughly ten minutes. Sensitivity and specificity for ≥70% stenosis came in at 90.9% and 99.8% respectively — strong numbers for a first multicenter validation.
The second is CREDENCE, whose CCTA-specific accuracy data is reported in the Griffin et al. CREDENCE substudy published in JACC: Cardiovascular Imaging in 2023 (N=303 stable patients). Per-patient AUC was 0.88 for ≥50% stenosis and 0.92 for ≥70% stenosis against core-lab quantitative coronary angiography. The detail I find most persuasive is what happened when Cleerly and QCA disagreed: in the 62 vessels with discordant reads, invasive fractional flow reserve agreed with Cleerly’s call in more than two-thirds of cases. That is not a trivial tiebreaker — it suggests the AI was picking up something physiologically real that the core-lab QCA read was missing, not just noise.
The third is CONFIRM2 trial results at TCT 2024 (van Rosendael et al., N=3,551 patients across 18 sites in 13 countries) — by far the largest cohort in this evidence base. AI-QCT quantification of lumen-diameter stenosis and non-calcified plaque volume was the strongest independent predictor of major adverse cardiac events, adding discriminative value on top of the Diamond-Forrester pretest probability model and traditional risk factors. This is the trial that moves Cleerly from “accurate imaging tool” toward “prognostic tool.”
The fourth is the Nurmohamed 10-year plaque-staging study (JACC: Cardiovascular Imaging, March 2024; if that link 404s, the same body of work is indexed at Cleerly’s clinical publications page). Through ten years of follow-up, AI-QCT plaque staging added prognostic discrimination for MACE beyond clinical risk factors, calcium score, and manually assessed CCTA alone — a decade of durability data is unusual in this field and worth taking seriously.
Now the honest part. This is a diagnostic and prognostic technology, not yet a randomized outcomes trial. There is not yet a CCTA-with-Cleerly-vs-standard-care randomized trial with a hard mortality endpoint. CONFIRM2 shows strong prediction of events; it does not yet prove that changing management based on Cleerly output actually changes outcomes. That is the ongoing question, and it is the direction the field is currently running trials to answer.
Where Cleerly changes the conversation with a patient
In the exam room, this technology changes the sequence of the conversation. A patient with a positive stress test used to face a fairly binary path — go to the cath lab, or continue watchful waiting on a statin. Now the sequence looks more like: CCTA (the anatomic look) → Cleerly (the quantitative plaque phenotype and burden) → an actual risk-stratified conversation about what to do next.
Three patient archetypes I actually see illustrate why this matters:
- The 48-year-old executive with an LDL of 130, a strong family history, and a normal stress test who wants to know whether he needs a statin. A calcium score of zero misses the 15-20% of premature MI patients whose plaque is entirely non-calcified. Cleerly can see it when a calcium score cannot.
- The 62-year-old with a moderate 50% stenosis on CCTA who is trying to decide whether to accept an invasive cath. In the retrospective PROMISE trial downgrading analysis and CONSERVE trial data, Cleerly downgraded roughly 41% of “significant” stenoses, and in modeled workflows could reduce invasive coronary angiography referrals by 87-95% in stable patients with no added one-year MACE risk. That is a modeled reduction in invasive angiography, not an RCT-proven one, and I frame it that way with patients.
- The 55-year-old on GLP-1 therapy and semaglutide who wants an objective way to know whether her lifestyle and pharmacologic intervention is actually stabilizing her coronary disease over 24 months. That is the disease-tracking use case, and it is the closest thing we currently have to a treat-to-target model for atherosclerosis itself.
The honest limits, tradeoffs, and how a physician should filter this
Here is where I get careful, because a tool this good deserves scrutiny, not enthusiasm alone:
- Selection bias in the trials. CLARIFY and CREDENCE enrolled patients already referred for invasive workup or who were symptomatic. That is not the same population as the asymptomatic 45-year-old executive walking into a longevity clinic asking for prevention. The AUC in a lower-prevalence population will be lower — Bayes rules the world, and no AI model escapes that math.
- Scan quality dependency. Cleerly is only as good as the CCTA it analyzes. A scanner with poorly controlled heart rate, or a scan with motion artifact, produces a report with real limitations. This is why the imaging center matters as much as the software behind it.
- Radiation dose. A modern prospectively gated CCTA is typically 1-3 mSv — comparable to a year of background radiation exposure — but it is not zero. For an asymptomatic patient, that is a real conversation, not a shrug.
- Reimbursement is evolving. A Category I CPT code 75580 now exists for the Cleerly ISCHEMIA analysis, and Cleerly Labs has an established payer pathway, but out-of-pocket cost is still real and coverage varies by carrier and by clinical indication.
- We do not yet have randomized outcome data proving that changing management based on Cleerly output reduces MI or mortality. CONFIRM2 shows the prediction is real; the management-change → outcome trial is what the field is running right now. The Palmetto GBA local coverage determination lays out the current evidence bar regulators are using to decide coverage, and it is worth reading if you want the unfiltered version of this debate.
How I think about Cleerly in a Pravida longevity + regenerative care plan
Most of Pravida’s patients come to us for musculoskeletal or performance concerns. Cardiovascular risk is, statistically, the actual thing most likely to kill them. That reframes how I sequence the workup for a longevity-focused patient.
The baseline workup for that patient includes an advanced lipid panel with ApoB and Lp(a), a hs-CRP, an HbA1c, a DEXA scan for body composition, and — when clinically indicated — a CCTA with Cleerly analysis to see the coronary tree directly rather than infer it from risk factors alone.
If Cleerly shows meaningful non-calcified plaque burden or a vulnerable phenotype, the treatment ladder is real and specific: aggressive LDL-lowering with a statin, ezetimibe, or a PCSK9 inhibitor where warranted — the outcomes evidence for that class comes from LDL-lowering trials such as FOURIER (Sabatine et al.) — Lp(a)-directed therapy where clinically appropriate, since Lp(a) as a residual risk marker is now formally recognized in the 2024 AHA scientific statement, blood pressure and glycemic optimization, a cardiometabolic exercise prescription, and in select patients, GLP-1 or metabolic co-therapies.
The rescan interval is typically 24 months on a stable regimen — the Cleerly workflow explicitly builds this into the software rather than leaving it to memory. That is disease tracking, not one-shot diagnosis. And it is worth being explicit that Cleerly is diagnostic, not therapeutic. It tells us precisely what we are dealing with. Our job as physicians is what we do with that knowledge.
A calcium score tells you whether your driveway has a crack. A Cleerly CCTA tells you what is under the pavement, how deep it goes, whether it is spreading, and whether your repairs are working. Different scan. Different decision.
Curious about your own coronary risk?
At Pravida Health, we evaluate cardiovascular risk with the same evidence-graded approach we use for orthobiologics and longevity medicine — advanced lipid panels, imaging when it is indicated, and honest conversations about what the data does and does not tell us. If you are considering a CCTA with Cleerly analysis as part of a preventive workup, we can walk you through whether it makes sense for your situation.
Book a consultationCall 404.900.7371 · info@pravida.com
Key sources cited in this review
- Cleerly platform and product overview. cleerly.com and cleerly.com/what-is-cleerly
- Griffin WF, Choi AD, Riess JS, et al. AI Evaluation of Stenosis on Coronary CT Angiography, Comparison with Quantitative Coronary Angiography and Fractional Flow Reserve: A CREDENCE Trial Substudy. JACC Cardiovasc Imaging. 2023. jacc.org/doi/10.1016/j.jcmg.2021.10.020
- Choi AD, Marques H, Kumar V, et al. CT Evaluation by Artificial Intelligence for Atherosclerosis, Stenosis and Vascular Morphology (CLARIFY): A Multi-center, international study. J Cardiovasc Comput Tomogr. 2021. pubmed.ncbi.nlm.nih.gov/34158225
- AI-QCT validation literature review. pmc.ncbi.nlm.nih.gov/articles/PMC11262402
- van Rosendael AR, et al. CONFIRM2 registry results presented at TCT 2024. acc.org/Latest-in-Cardiology
- Nurmohamed NS, et al. AI-Guided Quantitative Plaque Staging and 10-Year Prognosis. JACC Cardiovasc Imaging. 2024. pubmed.ncbi.nlm.nih.gov/38127021 · cleerly.com/clinical-publications
- Interobserver variability in visual plaque characterization on CCTA. pubmed.ncbi.nlm.nih.gov/35986973
- Cleerly ISCHEMIA 510(k) clearance and CPT 75580 coverage. dicardiology.com
- Palmetto GBA Local Coverage Determination for AI-quantitative coronary CT analysis. cms.gov LCD PDF
- PROMISE and CONSERVE trial downstream-testing analyses. cleerly.com/plaque-analysis
- Sabatine MS, et al. Evolocumab and Clinical Outcomes in Patients with Cardiovascular Disease (FOURIER). N Engl J Med. 2017. nejm.org/doi/full/10.1056/NEJMoa1615664
- 2024 AHA Scientific Statement on Lipoprotein(a) as a residual cardiovascular risk marker. ahajournals.org/doi/10.1161/CIR.0000000000001123